Centennial Homes Colorado
Centennial is a city that prides itself on diversity, serving as a welcoming community that caters to the housing and recreational needs of individuals, couples, families, and more, all in an extraordinary manner.
This friendly city has earned a rank among the top 50 safest cities in the nation, as reported by a leading national newspaper. The bustling Centennial Airport ranks as the third busiest in the state, marking the city's significance on the map. The golfing and outdoor recreational facilities in Centennial are among the finest in the metro Denver area. The South Suburban Family Sports Ice Arena, a regular practice spot for the Colorado Avalanche National Hockey League, houses a nationally recognized ice skating complex that caters to all age groups.
Centennial is dotted with spacious community parks and cozy neighborhood parks perfect for picnics, volleyball games, or simply enjoying laid-back weekend afternoons. Some parks are equipped with an outdoor amphitheater, barbeque grills, walking and jogging paths, and playgrounds. The renovated Streets at SouthGlenn is a popular spot featuring outdoor shopping, a movie theatre, a variety of restaurants, and two breweries.
The city's neighborhoods exhibit a wide selection of homes, from historic structures to new constructions, available in an array of sizes and styles to suit any preference.
List of Zipcodes in Centennial Homes Colorado
| Zip Code | Zip Code Name | Zip Code Population |
|---|---|---|
| 80122 | Centennial | 32,373 |
Source: Census Bureau
Demographics
State
Colorado
County
Arapahoe County
City
Centennial
Population
114,508
| Zip Code | City | County | State | National | |
|---|---|---|---|---|---|
| Population | 32,373 | 114,508 | 654,892 | 5,759,582 | 331,426,769 |
| Population Density | 4,587.1 | 3,906.7 | 820.6 | 55.5 | 93.8 |
| Percent Male | 48.0% | 49.0% | 49.0% | 49.0% | 49.0% |
| Percent Female | 52.0% | 51.0% | 51.0% | 51.0% | 51.0% |
| Median Age | 46.2 | 43.7 | 38.9 | 40.2 | 39.0 |
| People per Household | 2.5 | 2.6 | 2.5 | 2.8 | 2.6 |
| Median Household Income | $100,613 | $106,157 | $75,120 | $115,942 | $61,963 |
| Average Income per Capital | $48,222 | $48,805 | $40,034 | $50,725 | $33,235 |
Source: Census Bureau
Market Data
| Zip Code | City | County | State | National | |
|---|---|---|---|---|---|
| Median Sale Price | $517,500 | $510,000 | $402,500 | $425,100 | $277,796 |
| Median Age of Home | 53.0 | 49.0 | 47.0 | 39.0 | 49.0 |
| Homes Owned | 80.0% | 78.0% | 61.0% | 67.0% | 58.0% |
| Homes Rented | 16.0% | 19.0% | 34.0% | 23.0% | 31.0% |
| Homes Vacant | 4.0% | 3.0% | 6.0% | 4.0% | 11.0% |
Sources: Census Bureau / Homendo
Source: REcolorado
This free service is provided by your local Agent
How much is your Home worth? Click here to know...
Review current market value estimates for your home, or anyone else, anywhere in the USA.
180 properties on market in Centennial Homes Colorado
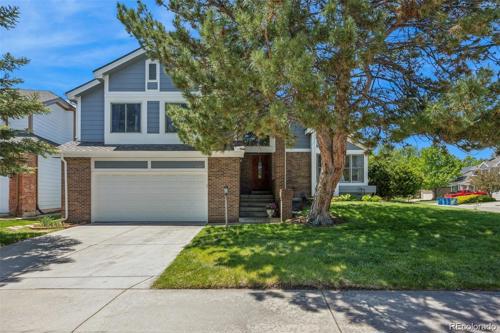 Active
Residential
MLS# 7291553 | 2024-07-27T01:40:17.549Z
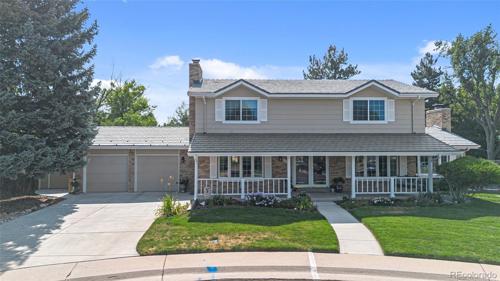 Active
Residential
MLS# 4268562 | 2024-07-27T00:09:17.493Z
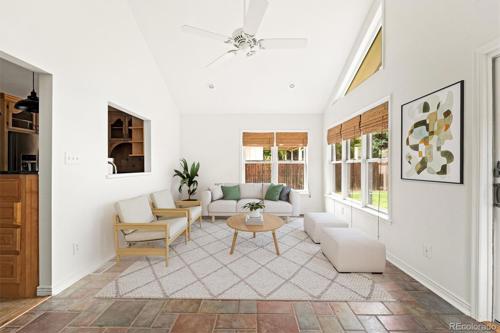 Active
Residential
MLS# 3336312 | 2024-07-27T00:04:17.282Z
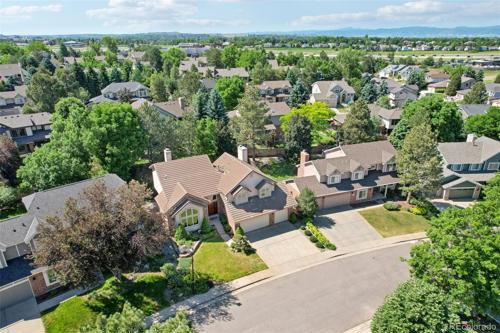 Active
Residential
MLS# 5720526 | 2024-07-27T00:03:18.553Z
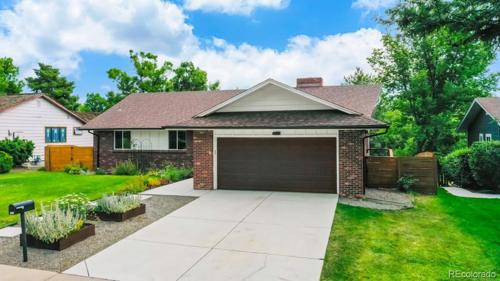 Active
Residential
MLS# 6787425 | 2024-07-26T23:05:17.606Z
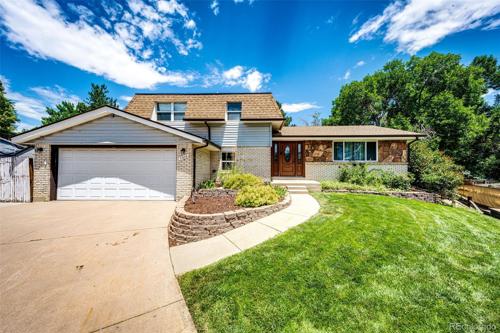 Active
Residential
MLS# 8267236 | 2024-07-26T22:09:17.617Z
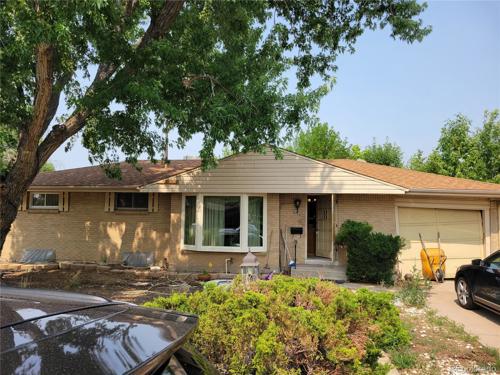 Active
Residential
MLS# 6658689 | 2024-07-26T21:52:16.349Z
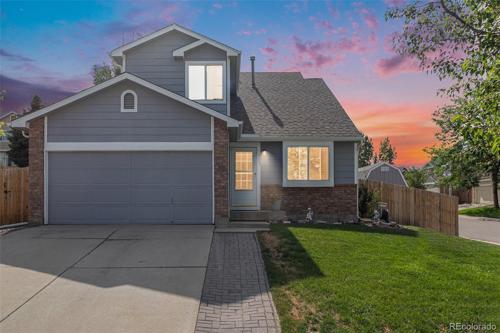 Active
Residential
MLS# 2738810 | 2024-07-26T21:45:16.486Z
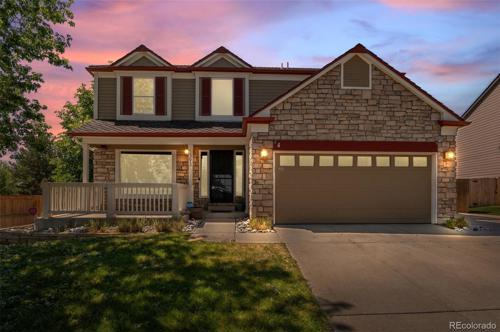 Active
Residential
MLS# 3679356 | 2024-07-26T21:35:16.373Z
This free service is provided by your local Agent
Need more listings? Click here to search now...
15 minutes updated and accurate properties direct from your local agent. Home Evaluation. Get Loan Pre-Qualified.
Vicki Mahan
RE/MAX Professionals
6020 Greenwood Plaza Boulevard
Greenwood Village, CO 80111, USA
6020 Greenwood Plaza Boulevard
Greenwood Village, CO 80111, USA
- (303) 641-4444 (Office Direct)
- (303) 641-4444 (Mobile)
- Invitation Code: vickimahan
- Vicki@VickiMahan.com
- https://VickiMahan.com
Contact Me
Quality of Life
Cost of Living
104.0
Health Cost Index
117.0
Commute Time
23.0
Working from Home
7.0%
| Zip Code | City | County | State | National | |
|---|---|---|---|---|---|
| Cost of Living Index | 104.0 | 111.0 | 102.0 | 110.0 | 100.0 |
| Health Cost Index | 117.0 | 124.0 | 114.0 | 119.0 | 100.0 |
| Commute Time | 23.0 | 24.0 | 25.0 | 25.0 | 24.8 |
| Commuting by Bus | 2.0% | 2.0% | 3.0% | 1.2% | 2.1% |
| Commuting by Carpool | 7.0% | 7.0% | 11.0% | 11.0% | 13.5% |
| Commuting by Auto | 84.0% | 84.0% | 81.0% | 80.0% | 79.1% |
| Working at Home | 7.0% | 6.0% | 4.0% | 5.2% | 4.7% |
Source: Census Bureau
Walk Score®
Source: Walk Score®
Climate & Environment
January Average Low Temperature
15.9 °F
July Average High Temperature
89.5 °F
Annual Precipitation (inch)
18 inches
| Zip Code | City | County | State | National | |
|---|---|---|---|---|---|
| January Average Low Temperature | 15.9 °F | 15.9 °F | 15.9 °F | 13.7 °F | 22.6 °F |
| July Average High Temperature | 89.5 °F | 89.5 °F | 89.5 °F | 77.5 °F | 86.1 °F |
| Annual Precipitation (inch) | 18 in. | 18 in. | 18 in. | 19 in. | 38 in. |
Source: NOAA Climate
Schools & Education
Source: Great Schools
Safety & Crime
Violent Crimes
280.7
Property Crimes
1,082.6
| Zip Code | City | County | State | National | |
|---|---|---|---|---|---|
Violent CrimesCalculated annually per 100,000 residents |
|||||
| Assault | 159.7 | 112.0 | 291.4 | 246.3 | 250.2 |
| Murder | 2.2 | 1.8 | 7.2 | 3.8 | 5.0 |
| Rape | 66.3 | 42.1 | 79.5 | 67.2 | 42.6 |
| Robbery | 52.5 | 25.1 | 164.1 | 63.6 | 81.6 |
Property CrimesCalculated annually per 100,000 residents |
|||||
| Burglary | 214.9 | 240.0 | 461.7 | 348.4 | 340.5 |
| Theft | 264.5 | 1,337.3 | 2,008.4 | 1,858.3 | 1,549.5 |
| Motor Vehicle Theft | 603.2 | 176.5 | 569.1 | 384.0 | 219.9 |
Source: FBI - Crime Data Explorer


 Menu
Menu


